Background
Data visualization and infographics represent distinct concepts that should not be conflated.
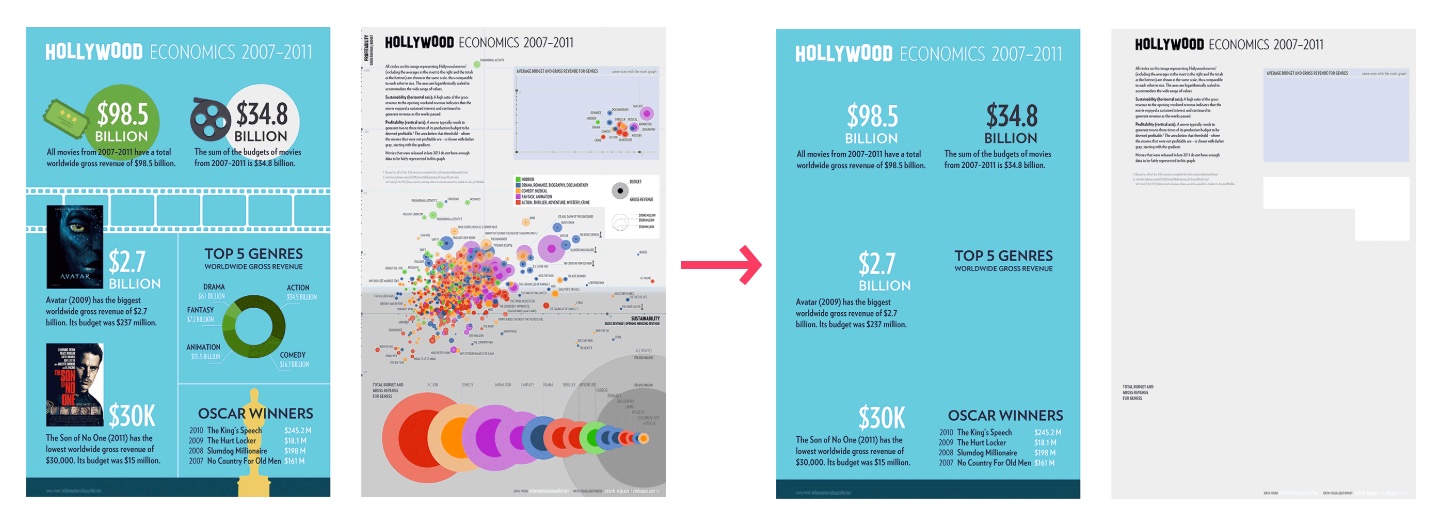
Infographics serve as instruments for examining datasets or comprehending intricate information through bespoke visual components. The removal of these visual elements results in the loss of significant portions of information, if not all, unless supplemented by explanatory text (Önduygu, 2015). Infographics represent complex entities, ideas, or processes using visual structures, either directly or indirectly via diagrams and similar means.
Blank container
Conversely, data visualizations employ attributes such as size and position of abstract visual elements to depict datasets, facilitating intuitive comprehension of extensive data tables, identification of notable patterns, and the generation of novel insights. Color is often utilized for communicative purposes in information visualization, such as categorization through color-coding (Önduygu, 2015).
Blank container
Blank container
Blank container
Blank container
Sources & Tutorials
- p5 js Working with Basic Data + CSV Files - YouTube The easiest way to start reading data from remote URL.
- Week 06: Data Visualization | Creative Coding Spring 2025 Online Check the Helpful Resources and Coding Examples sections.
- Data Visualization - YouTube A walk through on how to find free data sources such as governmental web sites, etc…
- Habit Tracker Visualization by Pat Vitra
- loadTable Documentation on P5JS Website
- The Data Garden Collective
Showcase From Students
Check the following works as well to exemplify the types of projects related to individual stories about data. You’ll find projects inspired by personal experiences, global data sets, and everything in between. Some visualize daily habits, others bring music to life through code, as our students learn to translate complex information into beautiful graphics.
Blank container
Participants’ data visualizations, The Data Garden Collective

Blank container
Fatma İmran, Link to p5JS code
Blank container
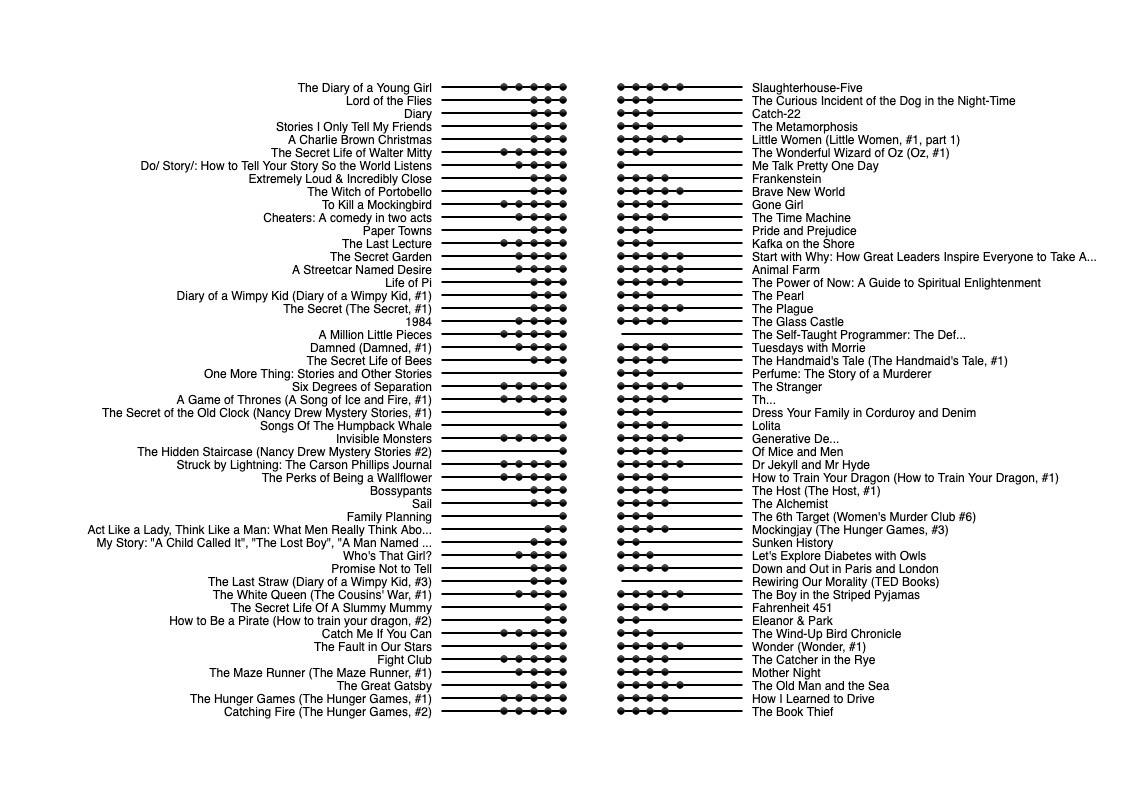
datavis casestudy Books by alptugan -p5.js Web Editor, Books
Blank
Life time expiration by Tutku Çalış, datavis-lifetime-case-3 by alptugan -p5.js Web Editor
Blank
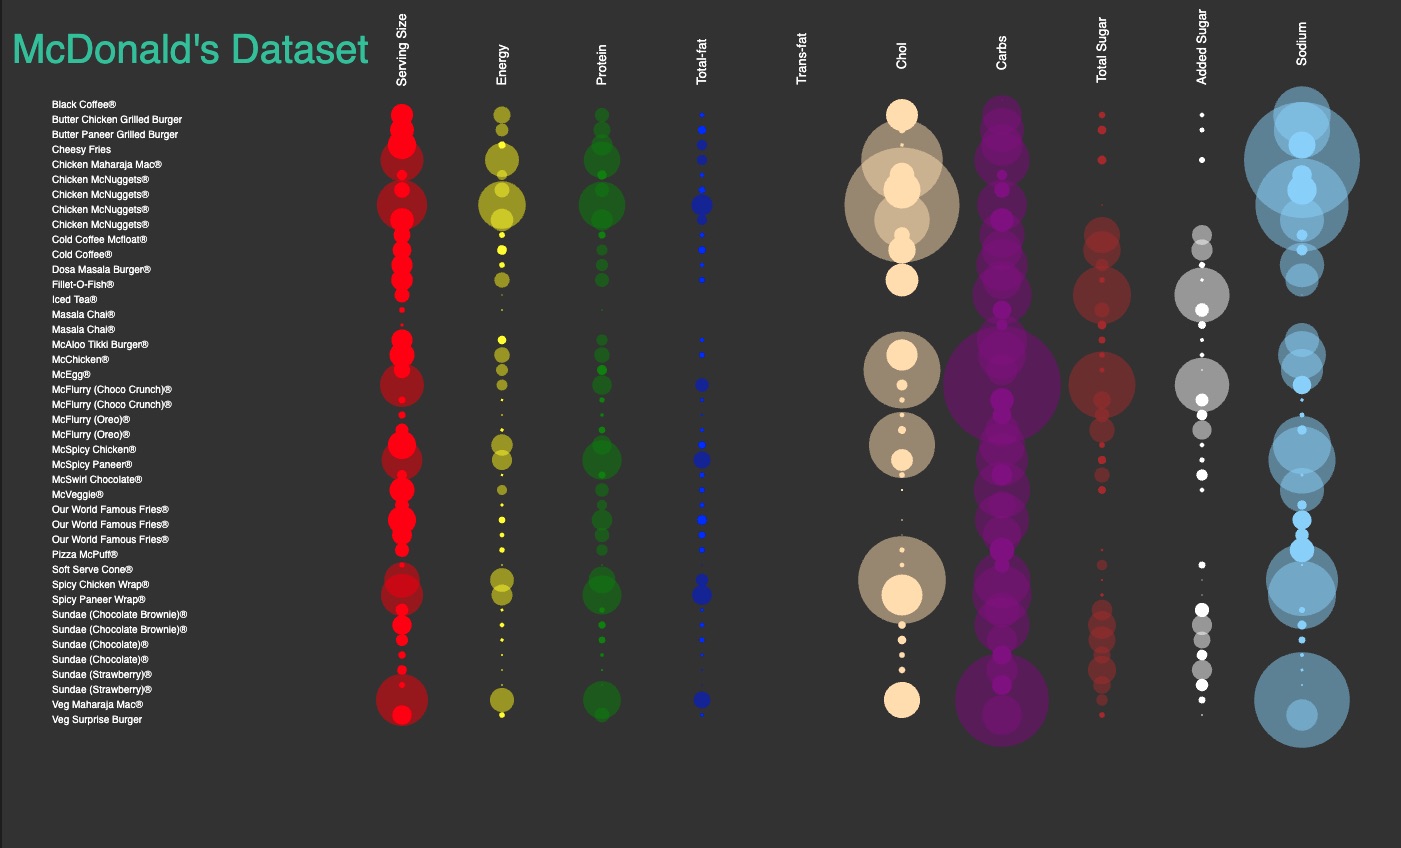
McDonals Data by Darya Mahçup, datavis-mcdonals-case 4
Blank
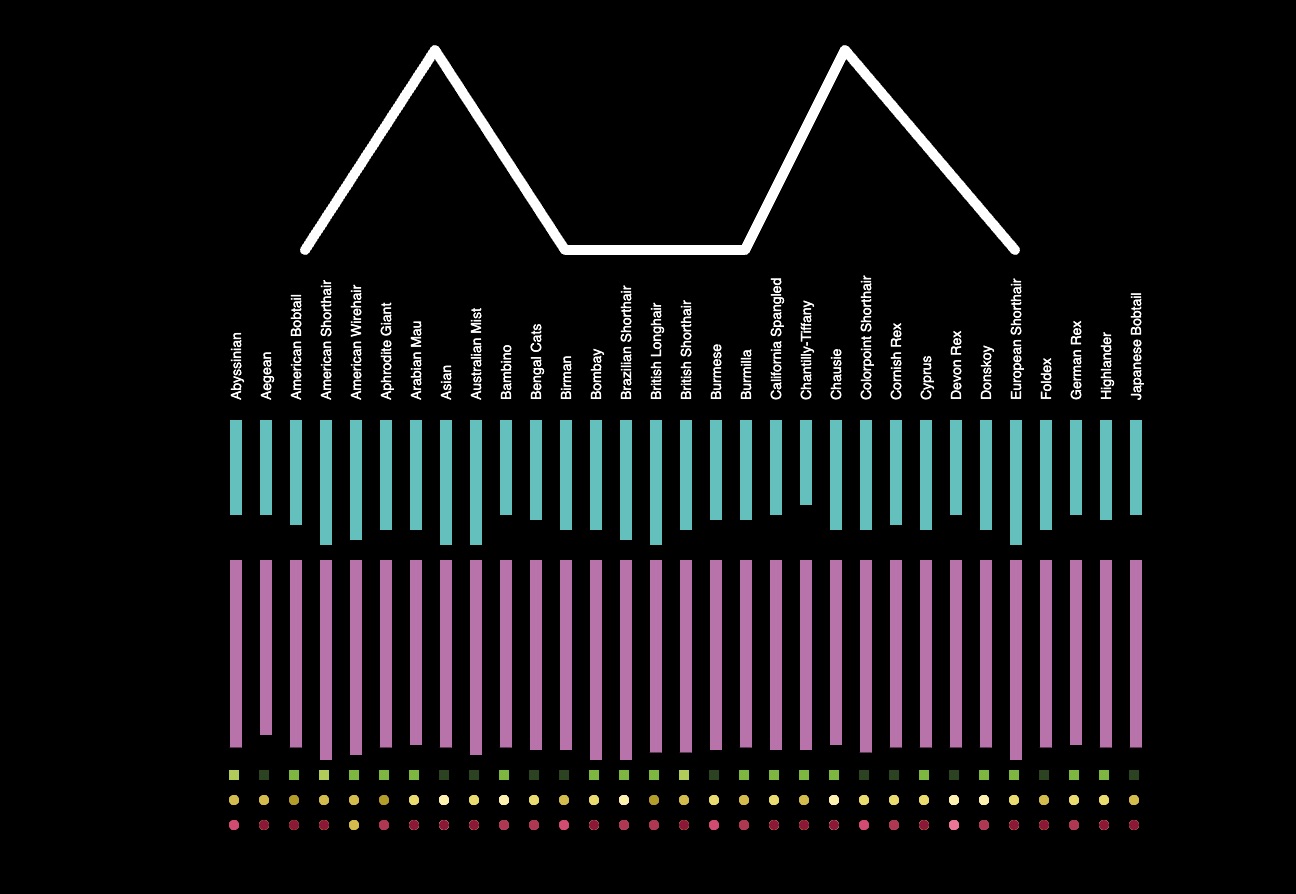
Cat Breeds by Melis, p5.js Web Editor | datavis-melis-cat-creeds-case 5
Case Study
Data Story-Telling
The Data Garden Collective specifically focused on visualizing any kind of data depending on personal interests. More information about the syllabus of the The Data Garden can be accessed via the link
Processing the Collected Data
- Find or create a table of data using Microsoft Excel or Google Sheets. Starwars Characters - starwars_characters.csv
- Export the data as
.csvfile. - Use one of the examples provided at Sources & Tutorials section to start visualize the data you gathered.
let data;

let nameArr = [];
let heightArr = [];

function preload() {
  data = loadTable("Starwars Characters - starwars_characters.csv", "csv", "header");
}

function setup() {
  createCanvas(1300, 900);
  noLoop();

  // number of columns - determines the number of properties (Keys)
  print("Number of Columns:", data.getColumnCount());

  // number of rows - determines the number of characters
  print("Number of Rows:", data.getRowCount());


  //print("Starwars Character Names", data.getColumn('name'));
  //print("Starwars Character Heights", data.getColumn('height'));

  nameArr = data.getColumn('name');
  heightArr = data.getColumn('height');

}

function draw() {
  background(200);
  textSize(10);
  textAlign(RIGHT);
  for(let i = 0; i < nameArr.length; i++) {
    text(nameArr[i], 100, 20 + 12*i);
  }

  for(let i = 0; i < heightArr.length; i++) {
    //text(heightArr[i], 150, 20 + 12*i);
    let redVal = map(heightArr[i], 66, 264, 0, 255);
    noStroke();
    fill(redVal,0,0);
    rect(110, 15 + 12*i, heightArr[i], 3);
  }

}
References
Deniz Cem Önduygu, Twitter, Webpage
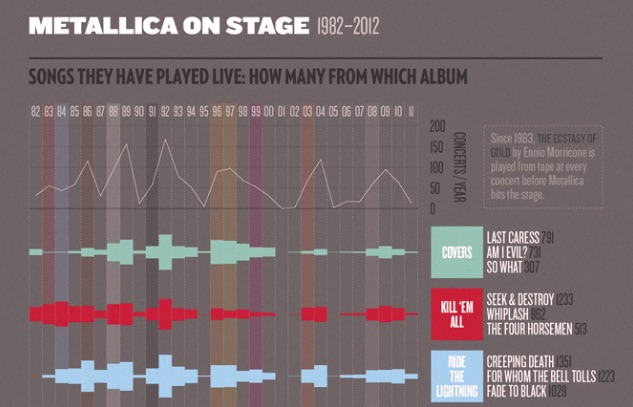
Önduygu, D. C. (2011). Metallica on Stage - Deniz Cem Önduygu
Önduygu, D. C. (2015). Redefining Infographics - Deniz Cem Önduygu
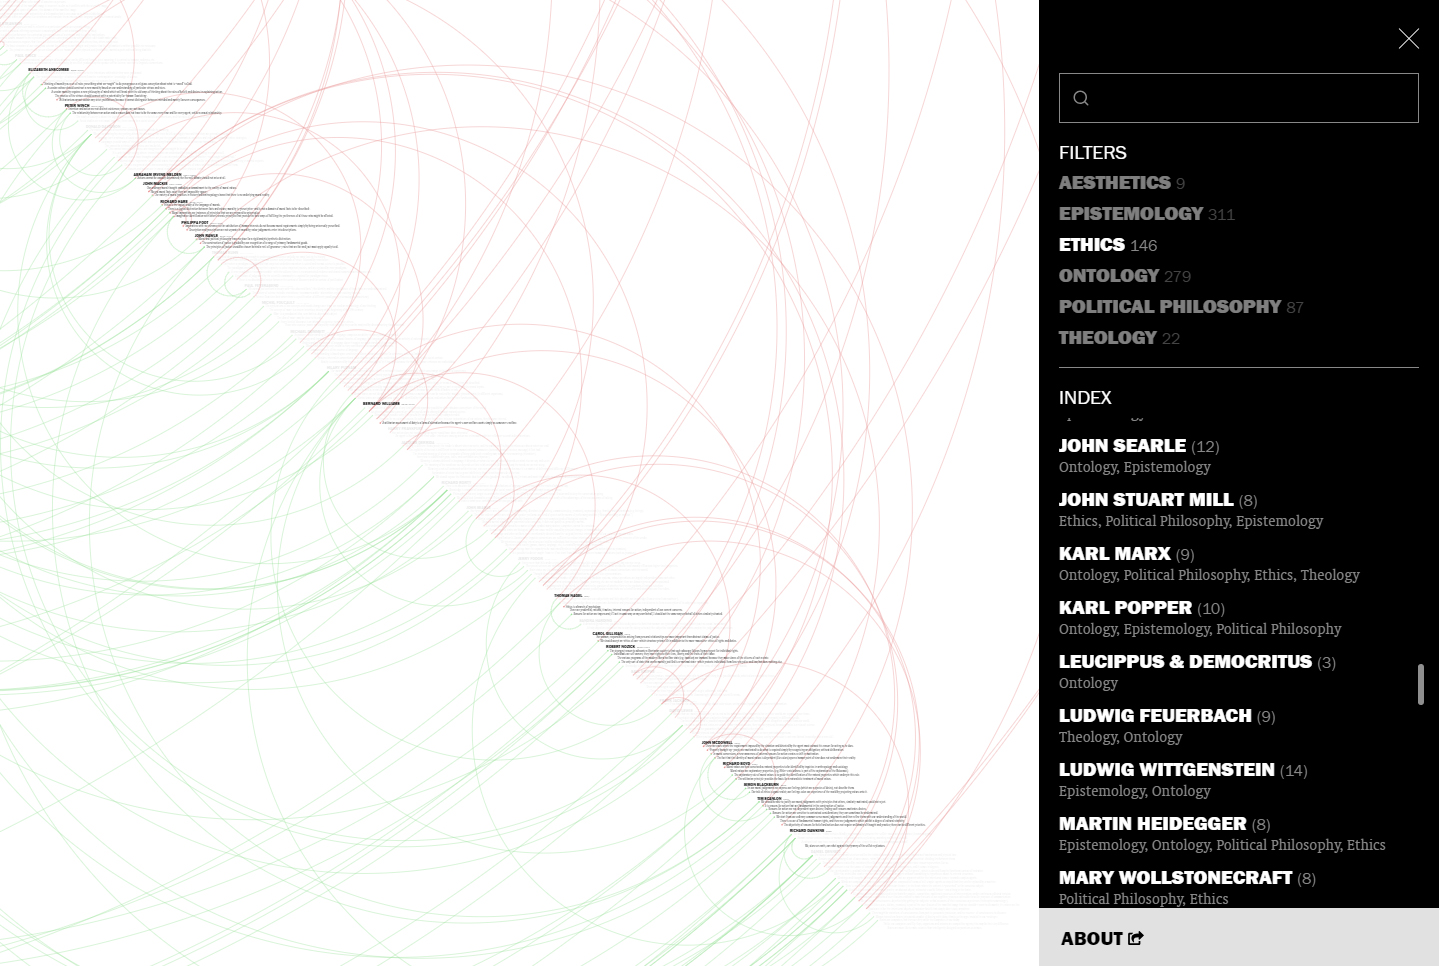
xÖnduygu, D. C. (2018). History of Philosophy Updated - Deniz Cem Önduygu
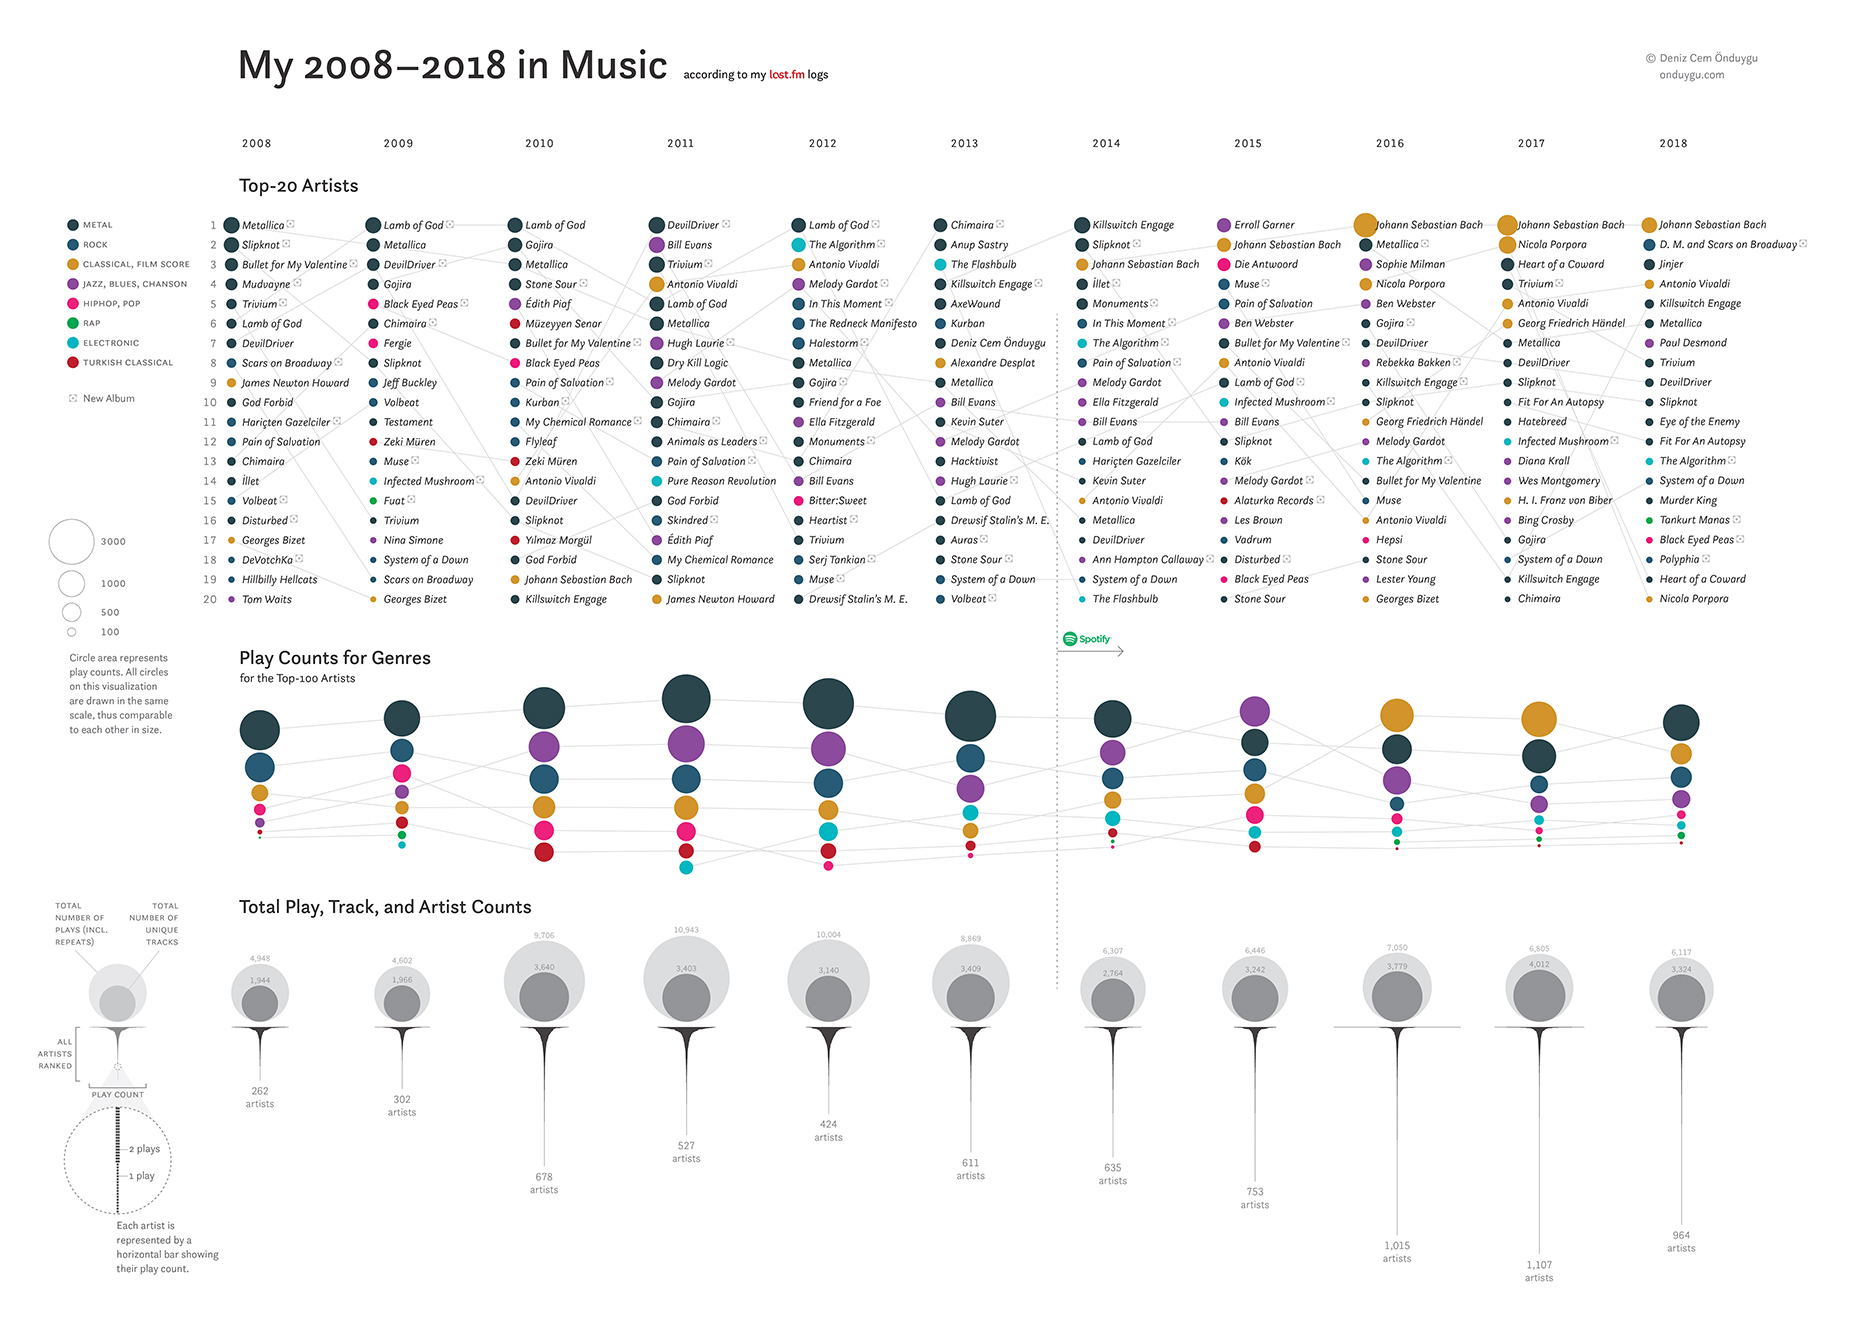
Önduygu, D. C. (2019). My 2008–2018 in Music - Deniz Cem Önduygu
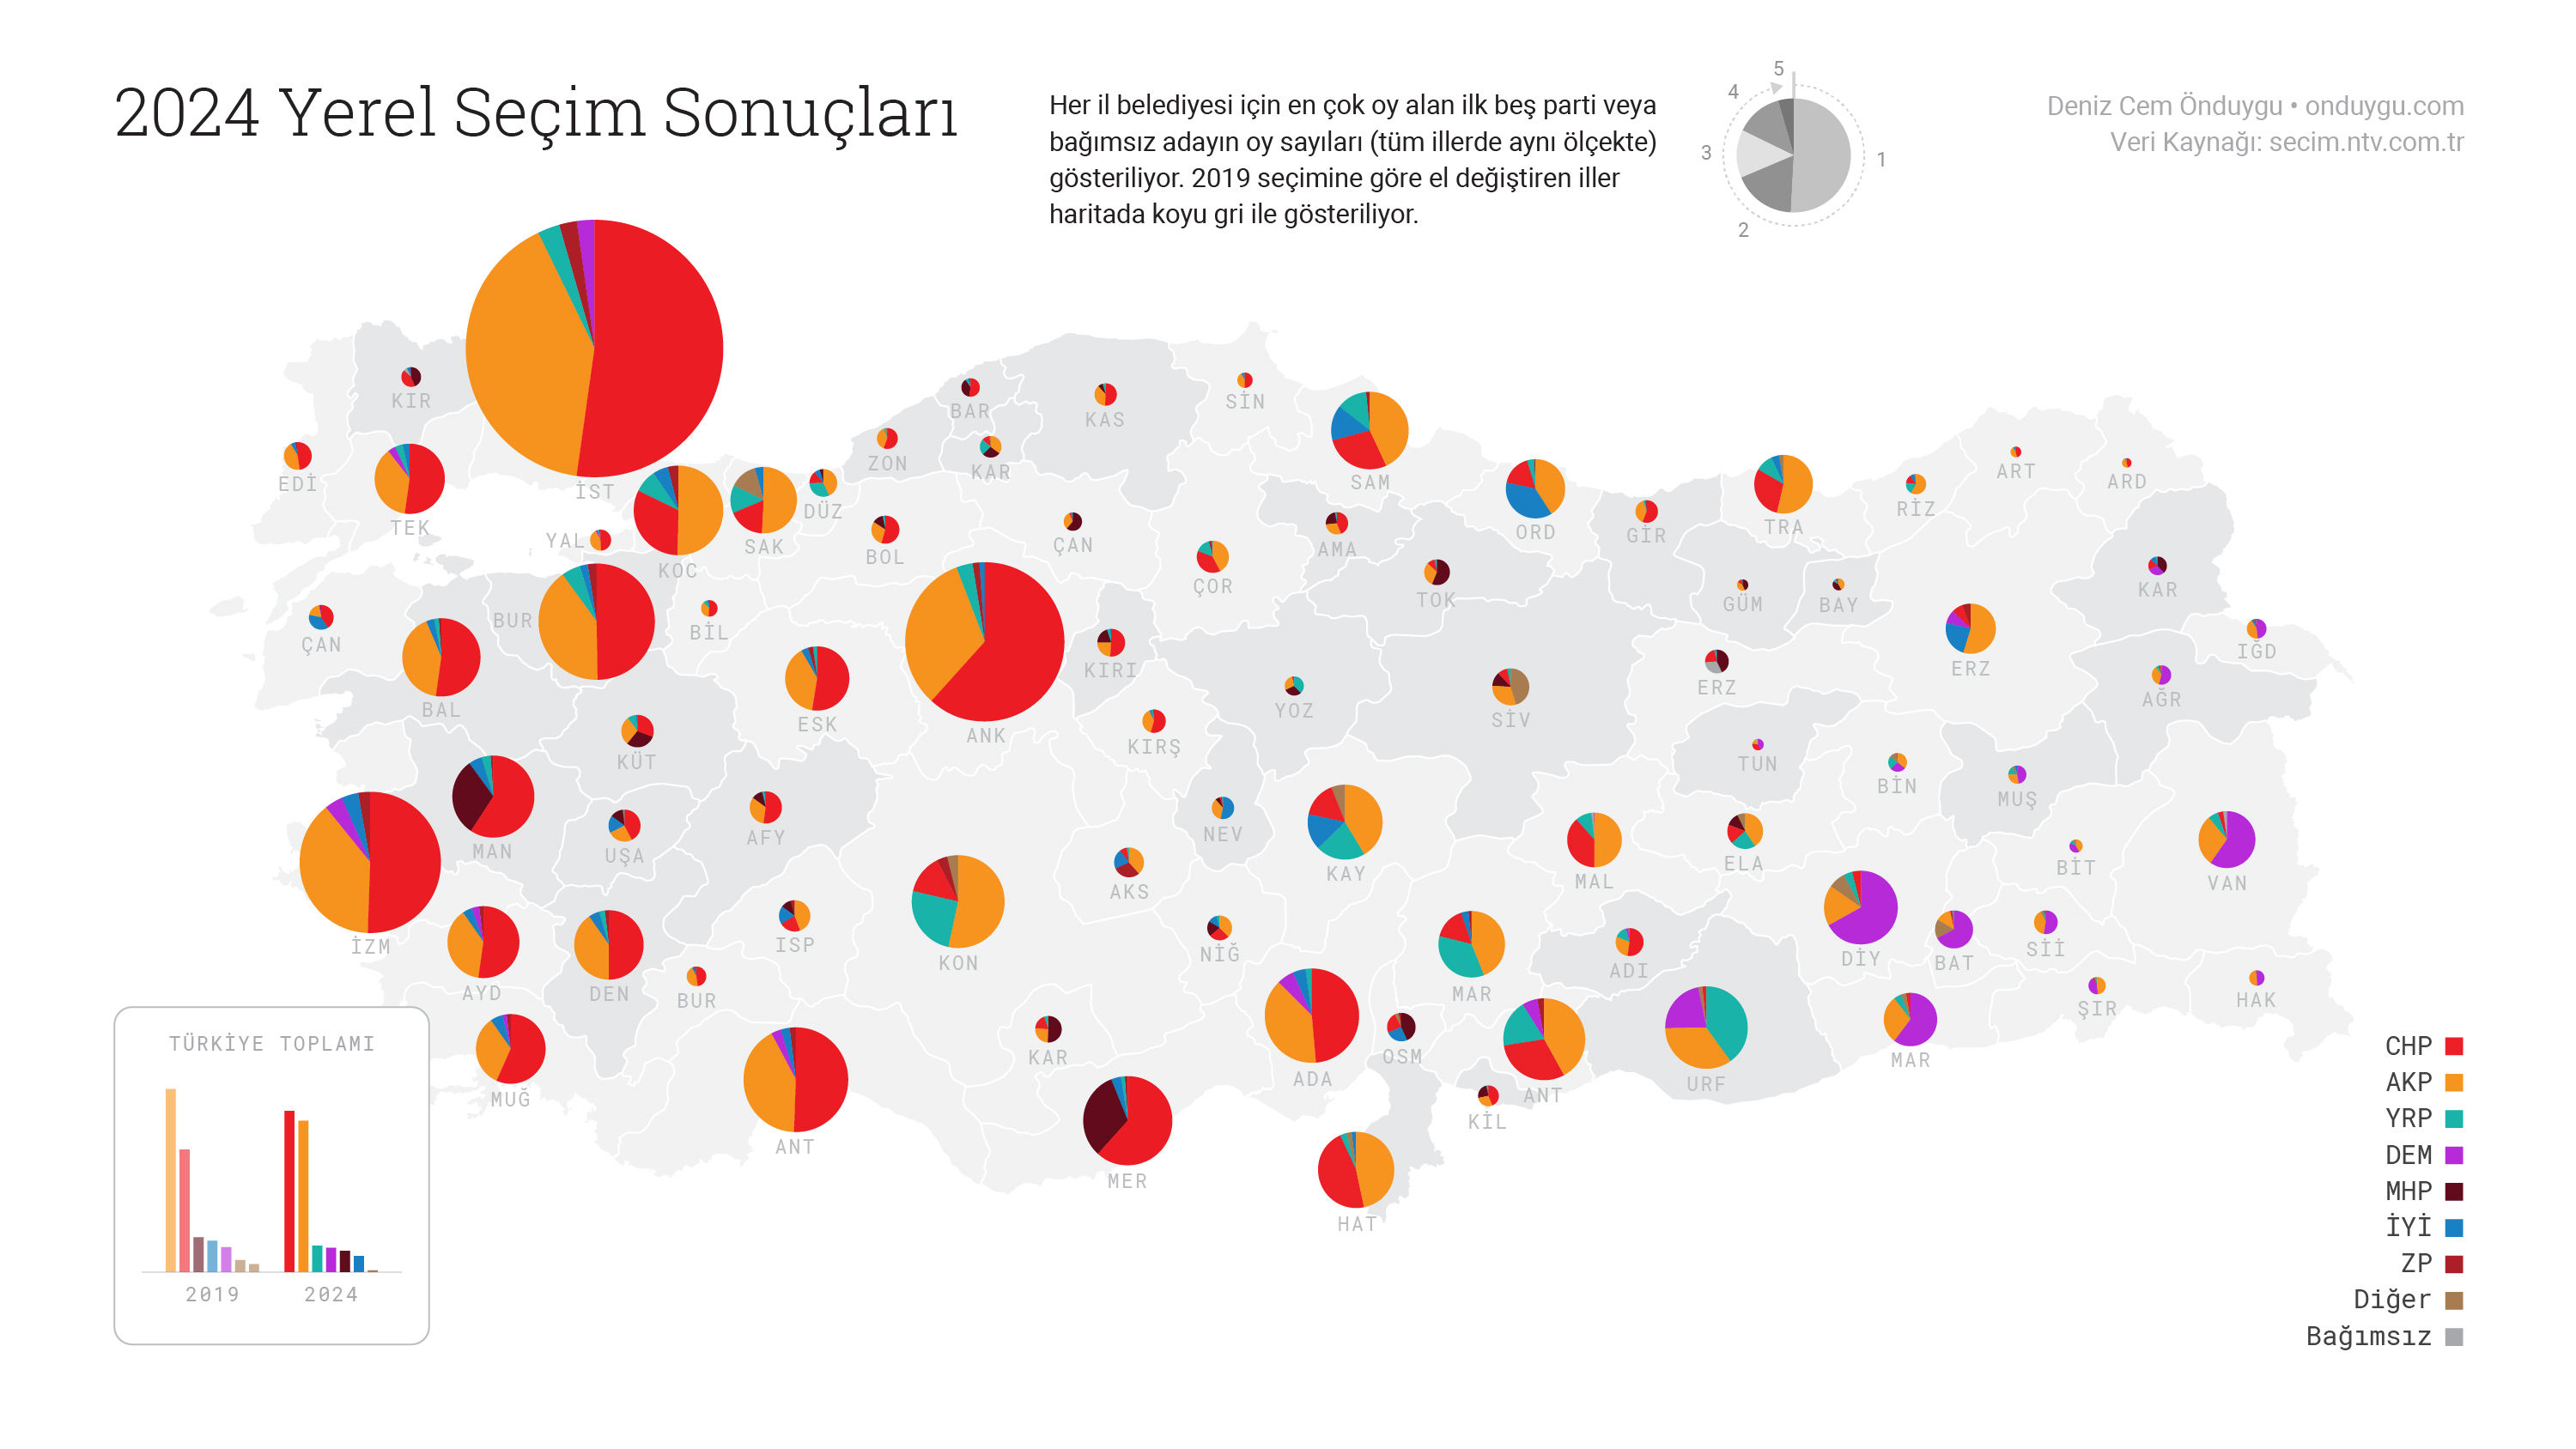
Önduygu, D. C. (2024). 2024 Yerel Seçimi: Nasıl Görselleştirmeli? - Deniz Cem Önduygu
Joanne Amarisa and Data Garden Project, “Module 1 Intro to Creative Coding with p5js”, (Google Slides), September 30, 2023.